
While people around the globe may be traveling more than ever tourism to the US is taking a dive, according to reports from the World Tourism Organization and the US Travel Association. The number of international tourist arrivals around the world reached 1.4 billion last year — a 6 percent increase and a bar reached two years ahead of forecasts. The organization predicted that number would grow by an additional 3 or 4 percent this year.
The US, however, is not seeing a similar rosy picture on the tourism horizon. Rather, in a condition often tabbed the “Trump Effect” by various media reports, US market share of world tourism has been dropping steadily in light of regular gun massacre incidents, economic affronts aimed at China, offensive international diplomacy policies and continued strength of the dollar.
International inbound travel to the US contracted once again in July, falling by 1.2 percent. The decline follows a disappointing June performance which saw the sector’s six-month trend fall below zero for the first time since September 2015. The Leading Travel Index (LTI), the predictive component of the Association’s Travel Trend Index (TTI), projects international inbound travel growth will remain negative over the next six months (-0.4%).
The worrying outlook for international inbound travel is consistent with U.S. Travel’s forecast, which projects America’s share of the global long-haul travel market will fall from its current 11.7 percent to below 10.9 percent by 2022, despite a projected annual increase in volume of inbound visitors to the United States.
The USTA believes that policy changes such as the long-term reauthorization of the Brand USA destination marketing organization, expanding the Visa Waiver Program to include more qualified countries and improving Customs wait times can help reverse the decline.
“The solid performance of the domestic leisure and business segments, which together account for 86 percent of the travel economy in the US, have kept the travel expansion on track through the first seven months of 2019 and have acted as a bulwark against the stagnant state of international inbound travel,” said U.S. Travel Senior Vice President of Research David Huether.
The TTI’s bright spot is domestic travel’s 3.8 percent expansion, which kept travel’s overall growth afloat. Domestic leisure travel surpassed its six-month average, increasing a robust 4.2 percent. Domestic business travel recovered from its -0.2 percent decline in June, rallying with 2.2 percent July growth.
Top Spots on the Inbound US Bucket List
Annual visitation to the U.S. began to decline in 2016 – and has yet to stop. Concurrently, Americans are traveling less frequently as well and are returning to in-country attractions less and less – often in search of something new and welcoming. The results of PGAV’s * fourth-annual Voice of the Visitor: Outlook on the Attractions Industry, which tracks Americans’ travel behavior and forecasts future plans, revealed a dramatic shift in the demographics of attraction visitors, and a deep desire to visit places that make them feel welcome and relaxed. PVAG is a St. Louis-based planning and design firm specializing in worldwide attractions and is responsible for such destination designs as the Space Shuttle Atlantis experience at the Kennedy Space Center Visitor Complex, Grand Canyon, Biltmore Estate, the Hoover Dam, and SeaWorld Adventure Parks.
The PVAG report revealed how travelers from Canada, Mexico, China, the United Kingdom, and Japan plan their trips to America, where they want to visit and what motivates them to do so, and why many have considered a visit to the States – but are holding off until later. Some 68 percent of responders had visited the United States before; but with the exception of Canada, the other four countries have more than a third of their population reporting they have never visited the USA.
Over 85 percent of international guests noted their key priority when visiting America is finding a safe and welcoming place that has a variety of activities and attractions, visiting more than two towns on average with each visit.
“Over the last several years, from the US Council of Mayors to the American Alliance of Museums to the Southeast Tourism Society and beyond, we’ve heard impassioned requests for insights into what international visitors think and what they’re doing when they enter “The Melting Pot;” and to date, we couldn’t find a precedent,” said PGAV Principal and Chair, Mike Konzen. “These visitors represent an immense contribution to our economy and share of the tourism industry – and in turn represent America when they return home through their stories and photographs – and it’s imperative we strive to better understand – and welcome – these guests.”
Top Five Motivators for International Travelers
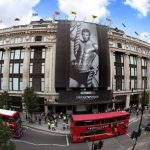
- 42%: Shopping
- 27%: Theme Parks
- 18%: Historic Landmarks
- 10%: Museums
- 10%: Sightseeing Tours
Top 10 Places Likely to Inspire a Visit to America
- 36%: Walt Disney World
- 26%: Disneyland
- 24%: The Grand Canyon
- 21%: Statue of Liberty
- 21%: New York City
- 20%: Niagara Falls
- 19%: Las Vegas
- 19%: Universal Studios
- 16%: Hollywood
- 14%: The Northern Lights
America is on track to become “minority white” country by 2045, with a Hispanic population projected to make up a quarter of the population, Blacks at 13 percent, Asians at 8 percent, and Multi-racial families at 3.8 percent. However, compared to the current racial majority, these groups are eight percentage points less likely to travel for leisure, seven percentage points less satisfied with their last attraction experience, eleven percentage points less likely to recommend that attraction to friends or family, and are five percentage points less likely to travel in 2019.
When Americans travel, trends suggest that they are seeking more peaceful time with friends and family to relax. Compared to five years ago, Americans note that they are “relaxing and chilling out” 27 percent more, playing video games 10 percent less, spending time outdoors 16 percent more, and hanging out with friends 5 percent less.
With more options for entertainment, consumers’ tolerance for bad service and low-fidelity experiences continues to decline, fueling dissatisfaction with the staff and offerings at many attractions.
Top 10 Attraction Types Visited in 2018
- 38%: Historic Landmarks
- 33%: Zoos/Animal Attractions
- 30%: Theaters
- 30%: Theme Parks
- 28%: History Museums
- 27%: National/State Parks
- 24%: Aquariums
- 22%: Family Entertainment Centers
- 21%: Art Museums
- 21%: Sightseeing Tours
Top Five Most Important Factors for American Tourists
- 79%: It’s a good value for the money
- 78%: It’s a clean place to visit
- 71%: It has friendly staff members
- 70%: It provides a safe and wholesome environment
- 69%: It’s a diverse experience with a lot of different things to see and do
* Conducted by H2R Market Research, Voice of the Visitor interviewed 1,500 American respondents who either visited an attraction in 2018 or plan to do so in 2019, providing a margin of error of +/-2.5% at a 95% confidence interval. Welcome!surveyed 985 travelers who have visited America, are considering visiting America, or who live in America, providing a margin.


Get Social