A traveler hits unexpected traffic on the way to the airport and isn’t quite sure where to return the rental car. In the terminal, there’s a huge line at check-in and uncertainty about the departure gate number because the mobile app on the traveler’s smartphone won’t load. Sound familiar?
Apps are the modern-day proving ground for traveler satisfaction. As travel apps rapidly replace everything from boarding passes to car rental and hotel room keys, many such apps are falling short of user expectations, according to a J.D. Power Inaugural U.S. Travel App Satisfaction Study released this week.
The study evaluates satisfaction with travel apps across four segments: airline; hotel; online travel agency (OTA); and rental car. It explores the key variables that influence customer choice, satisfaction and loyalty based on four factors: clarity of information provided; ease of navigation; overall appearance, speed of screens loading; and range of services/activities.

“Travel apps have come a long way,” said Michael Taylor, Travel Intelligence Lead at J.D. Power. “While some travel apps are delivering on their promise, others are missing the mark at critical moments of truth that can significantly influence traveler perception of brands and services. We see big swings in scores among travel apps when users evaluate searching and booking functions.”
Following are key findings of the study:
• Travel apps lag far behind customer financial apps in overall satisfaction.
The average overall satisfaction score for Hotel, OTA and Rental Car apps is 849 (on a 1,000-point scale). Airline apps score lower (840). By contrast, overall user satisfaction scores for credit card apps (874) and retail banking apps (867) are substantially higher. Both credit card and banking apps also have considerably higher levels of utilization.
• Day-of-travel performance is critical to travel app satisfaction.
Across all segments of travel apps, the key performance indicator (KPI) with the most influence on overall satisfaction is ease of use during travel. Hotel apps that users cite as “easy to use” score 130 points higher in overall satisfaction compared with apps that are perceived as more difficult to use. Among airline apps, that gap is 125 points. However, just 58% of hotel apps and 62% of airline apps currently achieve these levels.
• Rental car apps have lowest rate of adoption in travel industry.
Among app users that indicated they have a travel app already downloaded on their smartphone, airline apps lead the industry in customer adoption rate at 90%. They are followed by hotel apps (84%); OTA apps (78%); and rental car apps (59%).
AIRLINE APPS CATCHING ON
Airline apps have the highest levels of customer utilization of critical features during the day of travel, but the lowest performance in the industry when it comes to speed of screens loading during travel. OTAs perform best on this metric, with an average page load speed satisfaction score of 856. The average score for airline apps is 824.
Study Rankings:
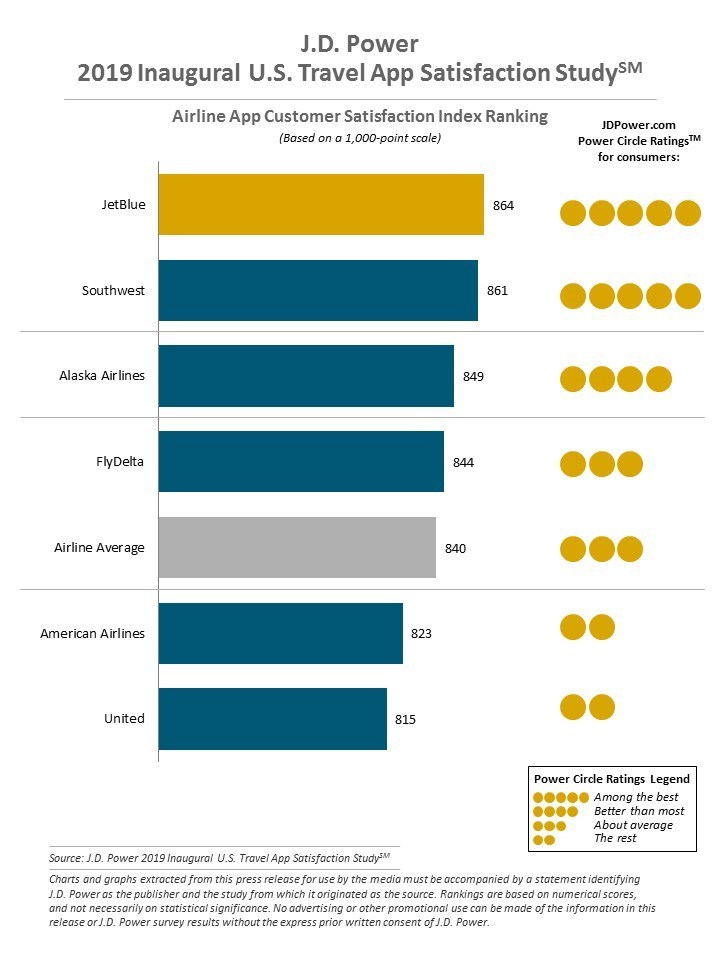
• JetBlue ranks highest in overall customer satisfaction, followed by Southwest and Alaska Airlines.
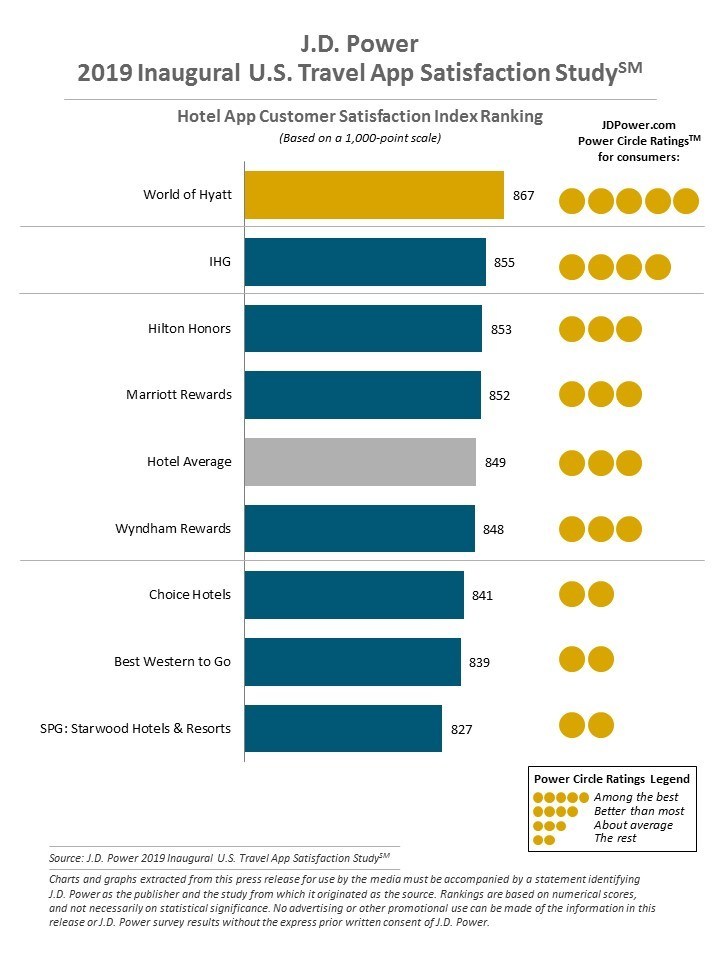
• World of Hyatt ranks highest in overall customer satisfaction among hotel apps, followed by IHG and Hilton Honors.
• Orbitz ranks highest in overall customer satisfaction among OTA apps, followed by Priceline and Expedia.
• National ranks highest in overall customer satisfaction among rental car apps, followed by Enterprise Car Rental and Hertz.
The J.D. Power Inaugural U.S. Travel App Satisfaction Study is based on more than 12,000 evaluations from users of airline, hotel, OTA and rental car apps, and was fielded from December 2018 through January 2019.


Get Social