
It’s easy to find out what plans travelers are making when you happen to be one of the largest travel sites on the planet. This year TripAdvisor decided to collect all the big data and take a bi-annual peek at where people are going and why – according to some 60,000 travelers and hoteliers around the world. The latest TripBarometer survey released last week shows that travel for Americans, and indeed travelers all over the world, is on its way up. And travel budgets are too.
TripBarometer Finidngs: at a glance:
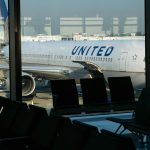
International Trips Up 14% for U.S. Respondents; Domestic Travel Remains Steady:
- 67 percent of U.S. travelers are planning to travel internationally in 2014 (up from 53 percent in 2013)
- 97 percent are planning a domestic trip this year, compared to 95 percent last year
- Among global travelers, 77 percent plan to travel internationally, up 12 percent compared to 2013
- 90 percent of global travelers are planning to travel domestically (up from 87 percent in 2013)
U.S. Travel Budgets on the Rise in 2014:
The average U.S. traveler budget is $8,272 this year, up slightly from $8,202 in 2013. This compares favorably to the average global traveler budget of $6,136, which was also up from last year ($5,955 in 2013.) The U.S. ranked #6 among the Top 10 countries expected to spend the most on trips in 2014. The complete global Top 10 travel spend rankings year-over-year are here:
| Markets that spent the most in 2013: Top 10(average of all countries after conversion into US$) | Markets that will spend the most in 2014: Top 10(average of all countries after conversion into US$) | ||||
| 1 | Switzerland | $11,619 | 1 | Australia | $12,393 |
| 2 | Australia | $10,528 | 2 | Switzerland | $11,575 |
| 3 | United Kingdom | $8,959 | 3 | New Zealand | $8,457 |
| 4 | Germany | $8,756 | 4 | United Kingdom | $8,351 |
| 5 | United States | $8,207 | 5 | Germany | $8,331 |
| 6 | New Zealand | $7,682 | 6 | United States | $8,272 |
| 7 | Canada | $7,396 | 7 | Canada | $7,429 |
| 8 | Ireland | $6,720 | 8 | Ireland | $6,559 |
| 9 | France | $6,718 | 9 | Brazil | $6,482 |
| 10 | Israel | $6,668 | 10 | France | $6,411 |
Vast Majority of U.S. Travel Decision Dependent on Deals:
Ninety-four percent of U.S. respondents say their choice of trip is influenced by the availability of a good deal or special offer. In fact, the majority of U.S. respondents say that “price” (97%) and “special offers” (47%) are important decision-making factors when booking their accommodation.
Twenty-two percent of U.S. respondents reported that currency fluctuations – the strength of the dollar relative to other currencies – would impact their travel plans. Of those travelers who say currency fluctuations will impact them, 58 percent will be even more diligent in their travel research to find the best price.
In contrast, hoteliers around the world are placing higher importance on online reviews rather than price to influence travelers’ booking decisions. According to the survey, 64 percent of hoteliers believe that online reviews have the biggest impact when travelers book accommodations, followed by price (50%) and recommendations from friends and family (45%).

U.S. Travelers Discuss Their Dream Destinations
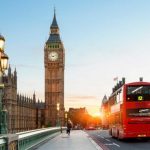
When asked about their dream destinations to visit, Italy, Australia and Ireland ranked as the Top 3 for U.S. travelers. Among non-U.S. respondents, the U.S. topped the list of dream destinations for travelers from Greece, Israel and Spain.
And the Winner is ….
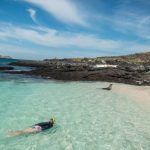
The Caribbean was the most visited region in the past year for U.S. travelers and is also the most popular destination planned for the coming year.
Meanwhile, Hipmunk, another popular online travel booking site, took the liberty of polling some 4,000 individuals in the first week of April about their travel plans for Summer 2014 and found that nearly three quarters planned a vacation, 22 percent had already booked and seven percent are skipping the trip this year. It also found that different travel interests and habits seem to dominate various age tiers. The survey exposed current travel preferences of Millennials (18 and 34), Generation Xers (35 to 54), seniors (55 and older), singles, and parents, while covering topics from top travel trends to favorite destinations.
Cost v Time
According to the study, cost isn’t the most common factor keeping respondents from enjoying a summer getaway. Of the 7 percent not traveling, 57 percent point to lack of free time as the reason they’re staying home this summer. And for Millennials not traveling, that percentage is 68 percent.
The survey also found that interest in travel technology is growing. 54 percent of respondents are eager for more Wi-Fi enabled planes and 34 percent are excited to check into hotel rooms with smartphones. In addition, 32 percent of parents would like to try self-service check-in kiosks at car rental locations.
“Travel can be so agonizing,” said Adam Goldstein, co-founder and CEO of Hipmunk. “When people are directing the process themselves — say, by checking in to a flight or hotel on their phone — at least they feel like they have some degree of control.”
Additional survey findings include:
Holidays and Destinations
- Fourth of July is the most popular summer travel holiday, with more than 40 percent heading out of town to celebrate, compared to 27 percent for Memorial Day and 33 percent for Labor Day.
- For a vacation that leaves a lasting impression, parents should head to Orlando or the great outdoors. Adults surveyed would have most enjoyed a summer vacation to Disney World (44 percent) or a national park like Yellowstone (19 percent) when they were kids.
- For those looking for a summer romance, location is key. Single women prefer the beach scene (37 percent, in contrast to 27 percent of single men, while single men prefer urban destinations (30 percent, compared to 22 percent of single women).
Budget and Savings
Flying mid-week is the most popular budget tactic with 69 percent of travelers willing to fly mid-week for cheaper fares. Red-eye flights are a popular money-saving option and Millennials are most likely to make use of them. Approximately 54 percent of Millennials are willing to fly overnight compared to only 34 percent of Generation Xers. Then, 18 percent of respondents are willing to take a chance and book their hotel last-minute to try out tools such as hotel deal apps.
Travel Trends
- Millennials are the most adventurous age group, with 36 percent interested in space tourism. Only 24 percent of Generation Xers and 15 percent of seniors are interested in leaving the atmosphere.
- Whether it’s for peace and quiet or to kick off an adults-only trip, 33 percent of respondents are interested in child-free zones on flights.
- Travel frequency just might increase if “Rover” could easily come along. About 53 percent of pet owners would travel more often if it were easier to travel with their pets.
Intel on Accommodations
- Millennials are most tuned into reviews and ratings. 77 percent of this age group consider reviews and ratings an important part of the decision making process, compared to 67 percent of Generation Xers.
- Price and location (in order) are the top considerations for all age groups when selecting accommodations, however, Millennials are the most price-conscious. 90 percent of Millennials rank price as the most important factor, compared to 81 percent of Generation Xers and 76 percent of seniors.
- With 64 percent admitting to snatching miniature bottles of shampoo and conditioner, toiletries are the most popular items taken from hotel rooms. Respondents are much less likely to take slippers (5 percent), towels (4 percent) or robes (3 percent).
Related Stories:
Where Have All the Families Gone?
Global Travel Trends Unveiled at WTM

Like us, Join us


Get Social